What the module does
Automatic segmentation
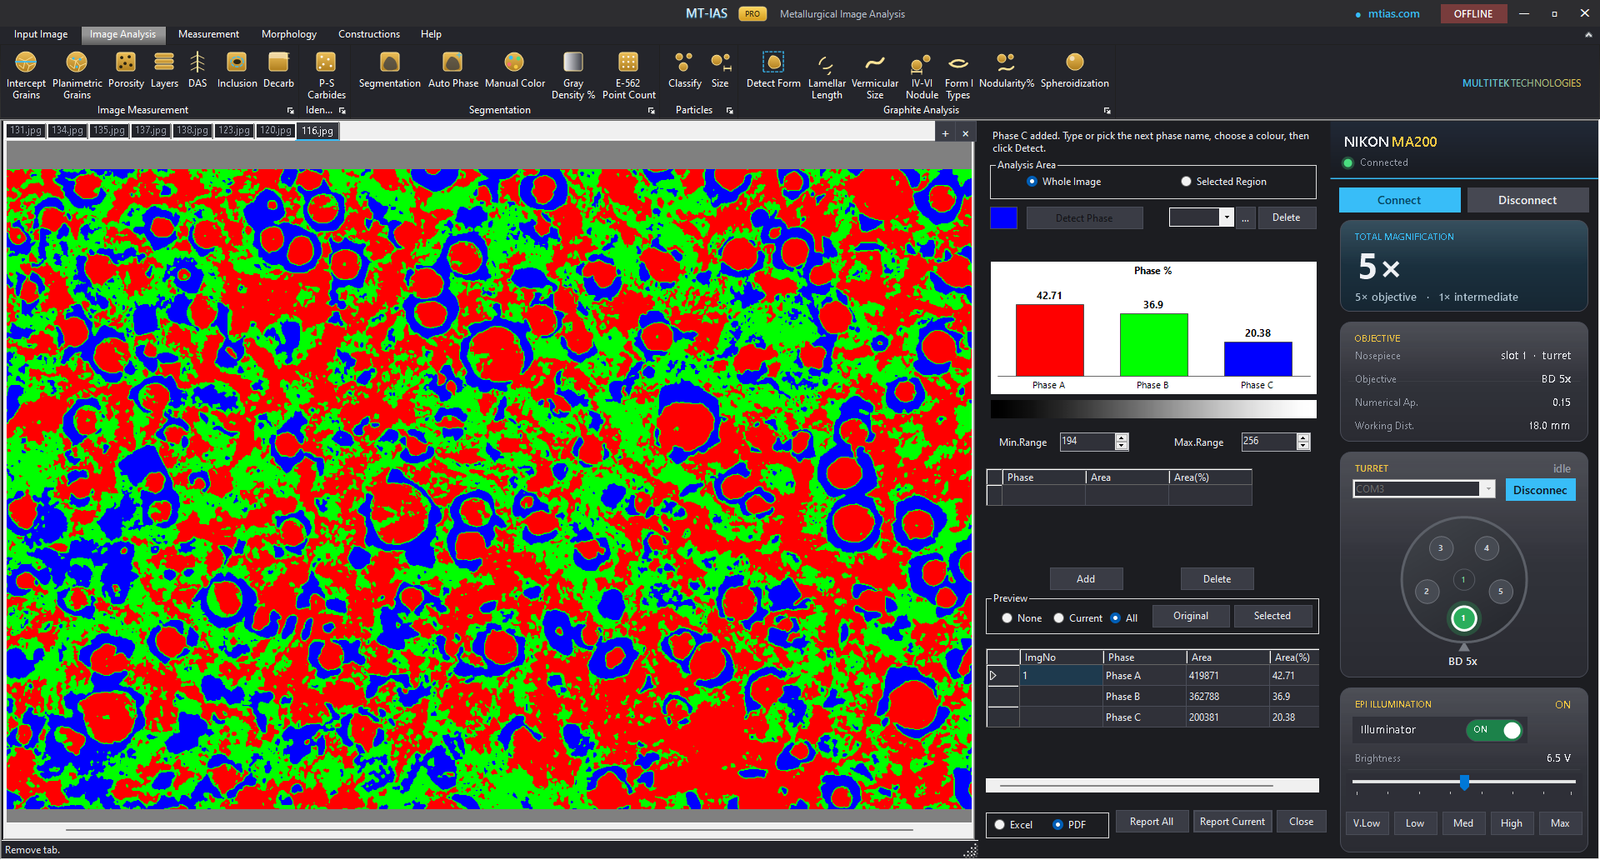
- Gray-density thresholding — phases separate by their etched contrast
- Manual segmentation tools for phases that don't threshold cleanly
- Live overlay — segmented regions shown in color over the micrograph
- Area fractions per field, accumulated across the sample
Systematic point count — ASTM E562
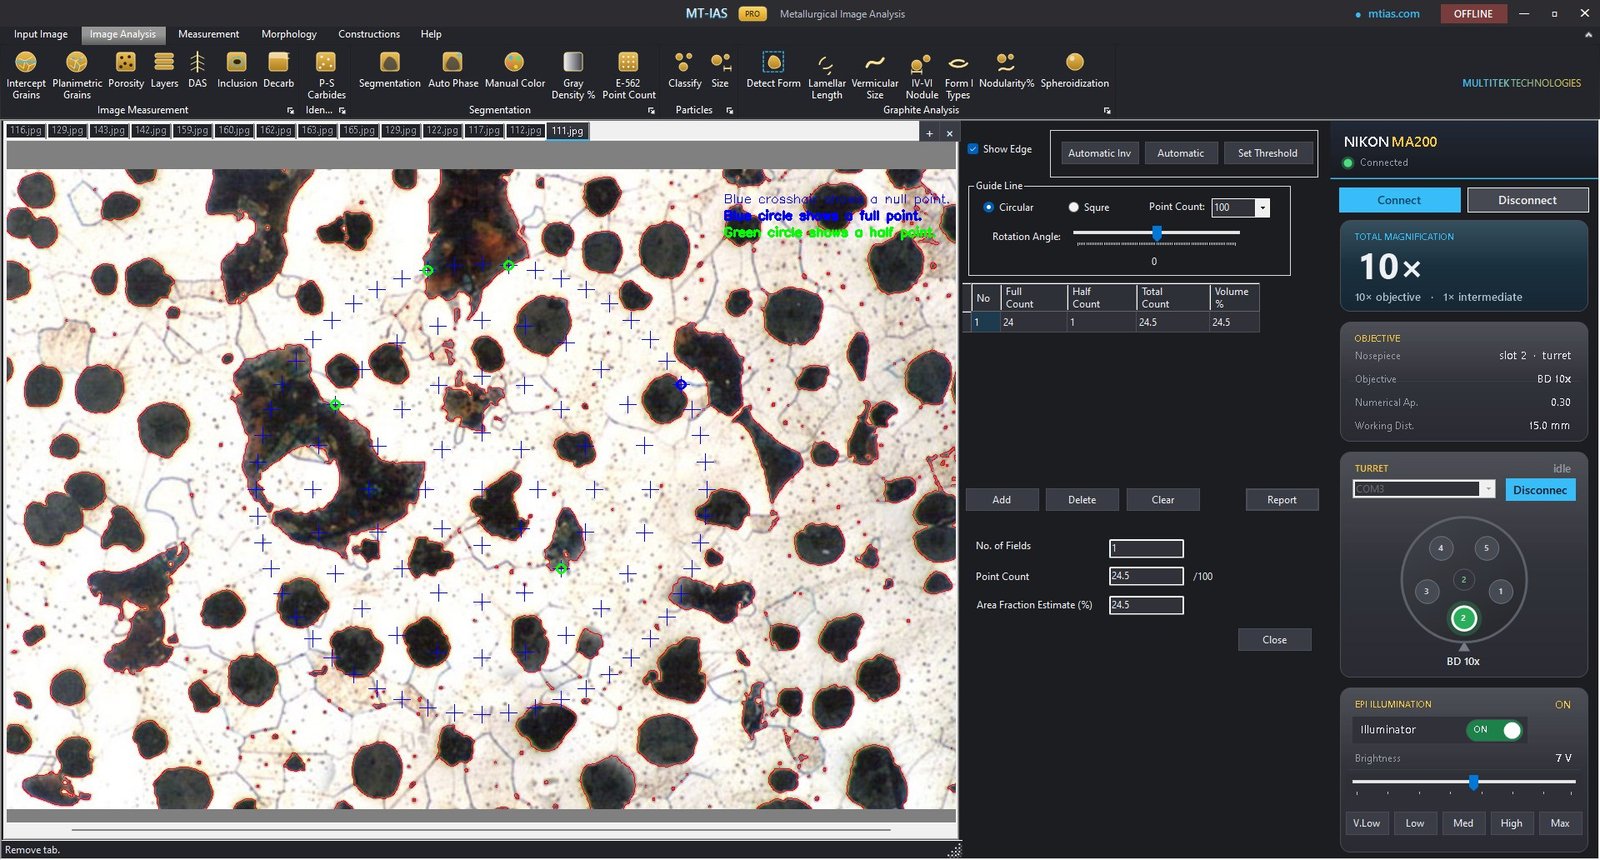
- On-screen point grid laid systematically over the field
- Operator tally — hits on the phase of interest, counted per E562
- Statistically grounded — the point fraction estimates the volume fraction
- Excel & PDF reports with per-field data and micrographs
From etched field to phase fraction
- Capture the etched field — phases need contrast; capture live at a calibrated objective.
- Choose the method — automatic gray-density segmentation for well-contrasted phases, or the E562 point grid when judgment is required.
- Segment or tally — adjust thresholds with a live color overlay, or step the grid and count hits.
- Accumulate fields — fractions build across the sample for a representative result.
- Report — phase percentages per field with micrographs, to Excel or PDF on your letterhead.
Module summary
| Item | Detail |
|---|---|
| Standard | ASTM E562 (systematic manual point count) |
| Methods | Automatic gray-density segmentation · manual segmentation · point-count grid |
| Result | Phase / constituent fraction (%), per field and accumulated |
| Overlay | Live color overlay of segmented regions and grid points |
| Calibration | Bound to the engaged objective |
| Reporting | Excel & PDF, customer letterhead, embedded micrographs |
Common questions
How does MT-IAS Pro measure phase fractions?
Two ways: automatic segmentation by gray-density thresholding (with manual touch-up tools), or systematic manual point counting per ASTM E562 with an on-screen grid. Use either — or both, cross-checking one against the other.
What is systematic manual point counting?
The E562 approach: a regular grid of points over the field, the operator tallies which points land on the phase of interest, and the point fraction estimates the volume fraction. Simple, statistically grounded, audit-friendly. Full walkthrough: Point counting, step by step.
When should I use point counting instead of automatic segmentation?
When etching contrast is ambiguous, when phases share gray levels, or when the specification explicitly calls for E562. Automatic segmentation is faster; the point count is the referee.
How are results reported?
Phase percentages per field, accumulated statistics and the micrographs export to Excel or PDF on your letterhead in one click.
Put a number on the microstructure
Bring a ferrite–pearlite steel or a coated sample to the demo — segment it, point-count it, report it.